Animal Impact Panels
The Animal Impact group is where MuirWave turns a source and a location into the numbers a marine-noise impact assessment actually has to contain: the per-hearing-group impact ranges that a regulator expects to see. This page walks every control in the Impact Ranges panel, explains what comes out the other end, and shows how the Export sheet turns it into a document.
What's in the group
Three tiles sit under Animal Impact in the rail (iPad / Mac) or dock (iPhone). One computes the impact ranges; one screens noise-abatement mitigation (a MuirWave Pro tool); one opens MuirWave's Export sheet, focused on this panel's own data and figures.
The source depth lives here too, and starts on AUTO. The Source Depth row in this panel is where the rays launch from, and therefore how the mitigation zones follow the seabed around your pin. It defaults to AUTO — mid-water for the depth under your pin, the convention published pile-driving assessments use — so you never have to enter it. Drag it when your source really is somewhere else (an airgun near the surface, a fixed projector); the AUTO chip beside the row puts it back. It reshapes the mapped zones; it does not move any range in the table.
This depth is separate from the Acoustics Setup one, on purpose — the two workflows are independent, so an impact assessment never inherits a number entered for a detection prediction, or vice versa. The map says which one you're looking at: while you're in the ANIMAL IMPACT group the source pin's DEP readout shows this panel's depth, marked AUTO when it's the mid-water convention rather than a figure you chose. Cross back to an ACOUSTICS panel and the same readout shows the Acoustics Setup source depth, blank (—) until you enter one.
How your inputs become the table
Every control in the panel feeds one of three stages: it either picks which criteria apply, sets the source level being propagated, or chooses how sound spreads with range. The panel then inverts that geometry per hearing group to find the range at which the received level drops to each threshold.
The core controls
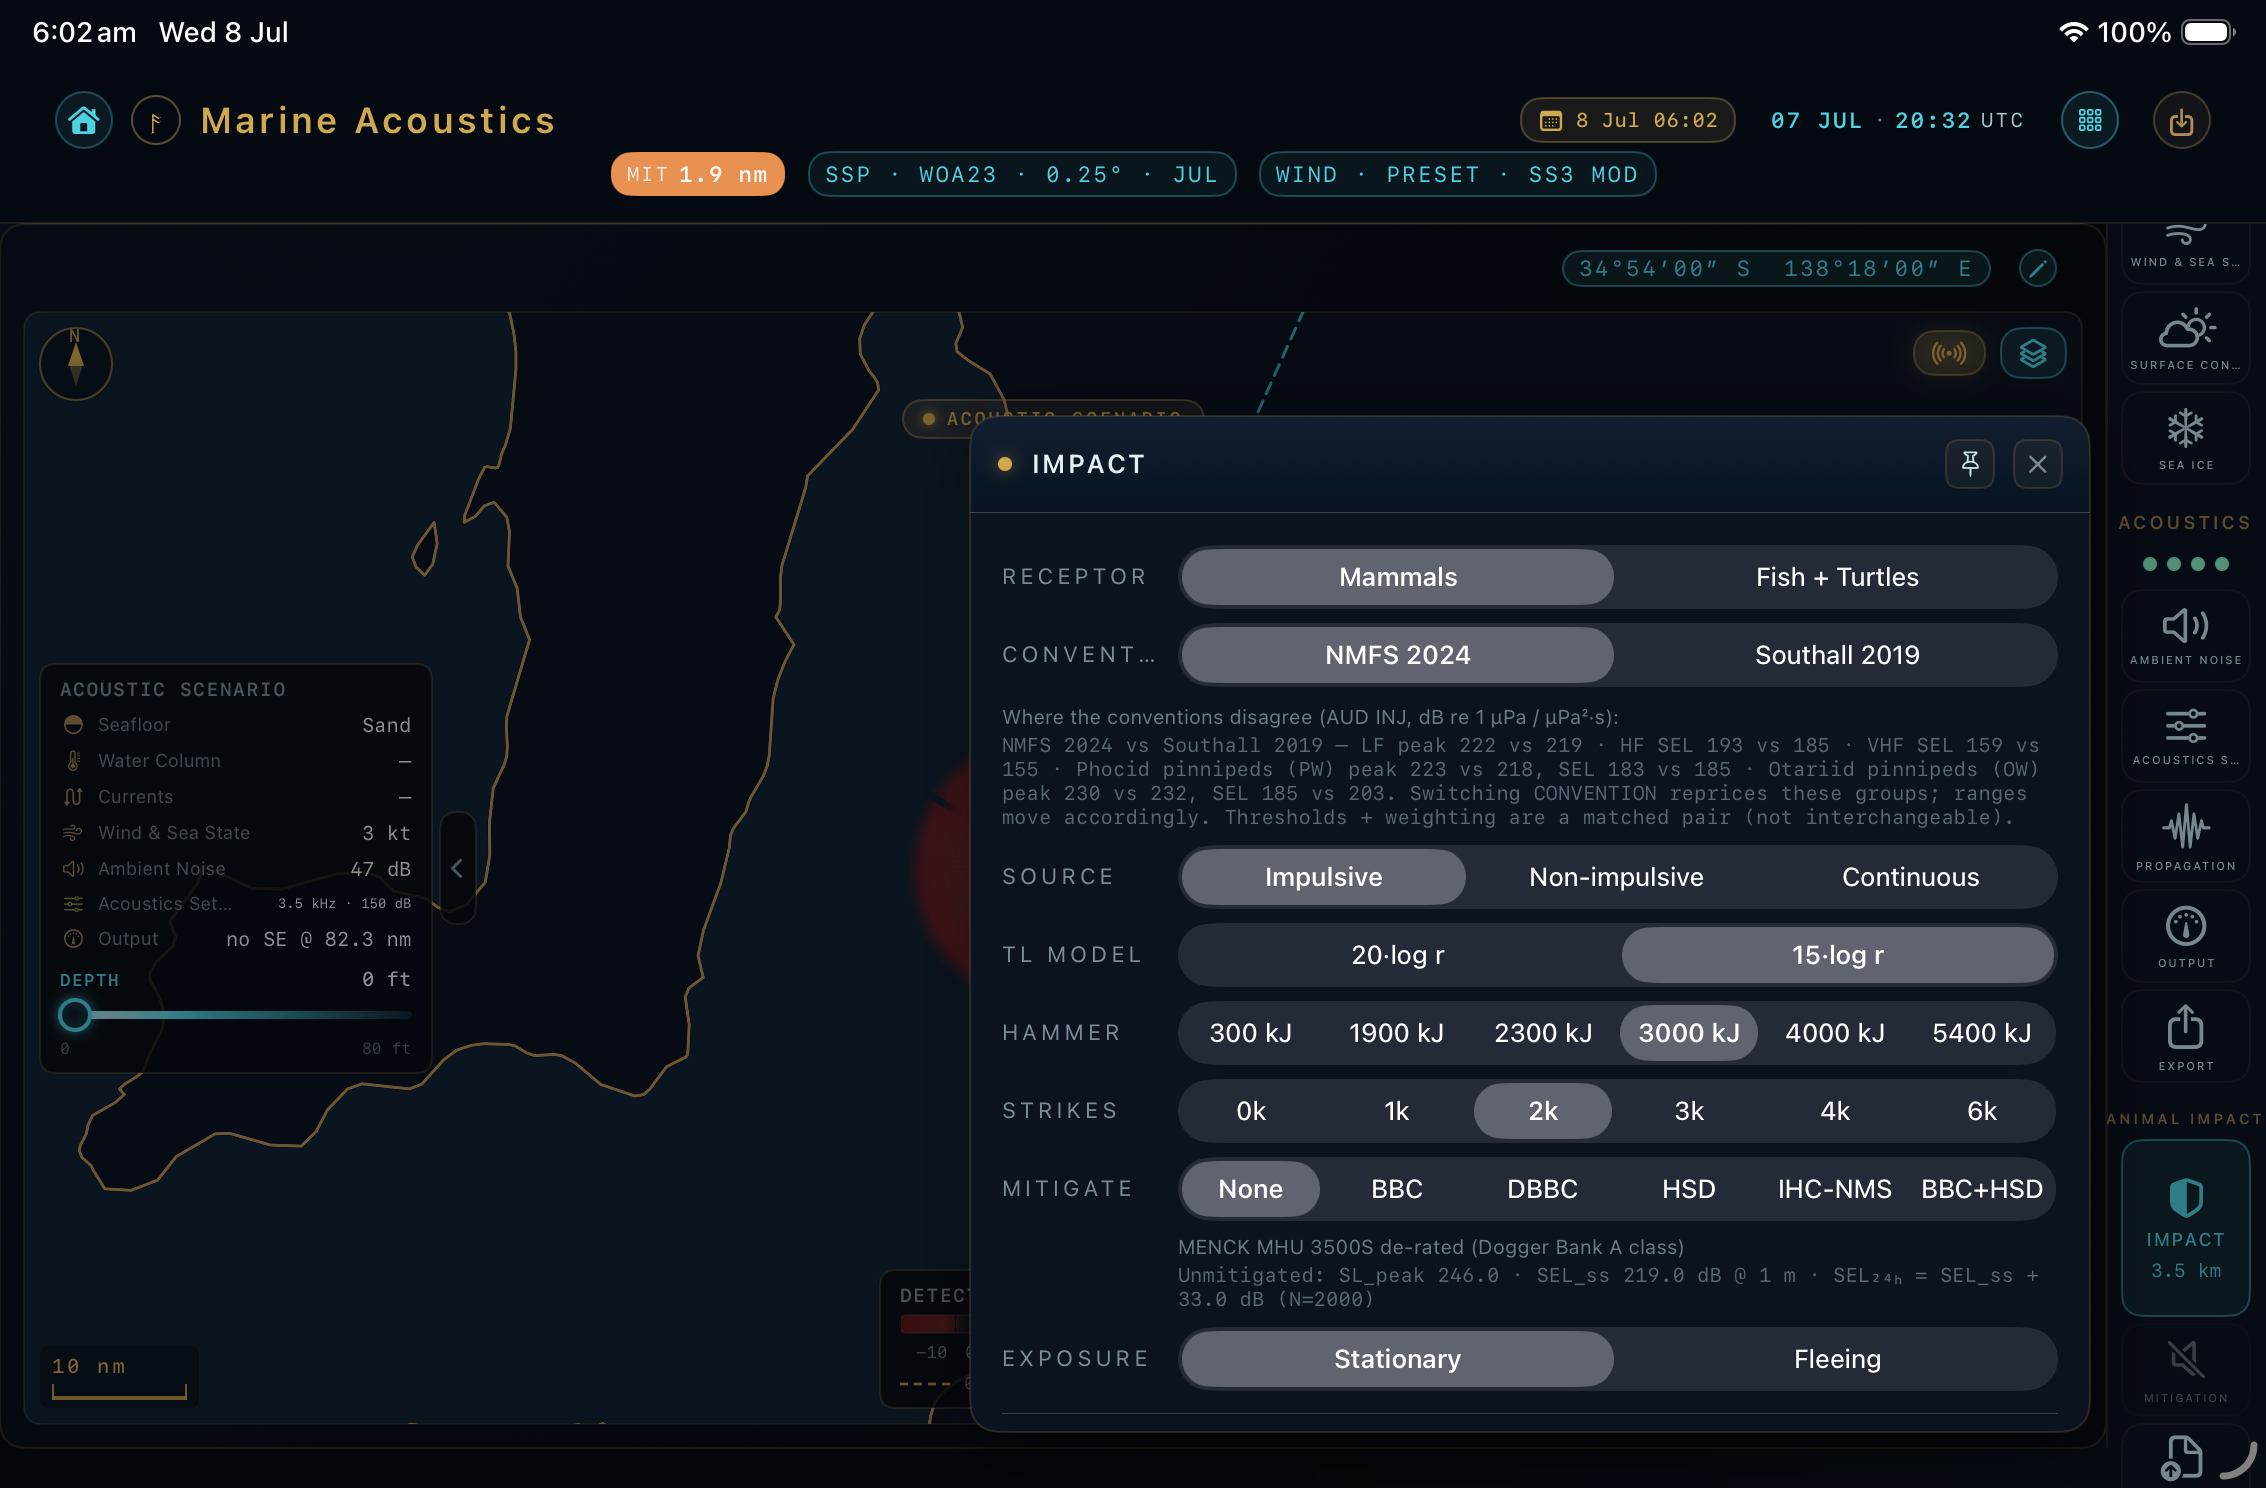
These segmented pickers appear for every scenario, top to bottom, and decide which criteria and spreading law the table is built from.
| Control | Options | What it does |
|---|---|---|
| RECEPTOR | Mammals · Fish + Turtles | Chooses the whole taxonomy. Mammals runs the marine-mammal hearing groups against auditory-injury thresholds; Fish + Turtles runs the Popper 2014 fish and sea-turtle groups instead. |
| CONVENTION | NMFS 2024 · Southall 2019 | Mammals only. Selects the matched threshold-and-weighting pair. The two are never mixed — an inline note lists exactly which groups the ranges move on when you switch. (Replaced by IMPACT for fish.) |
| IMPACT | Mortality · Injury · TTS | Fish + Turtles only. Picks which Popper et al. 2014 severity band to compute against — mortality / potential mortal injury, recoverable injury, or temporary threshold shift. Not every hearing group / source-type / severity combination has a published number — see Concepts → Impact thresholds for what a rating instead of a range means. |
| SOURCE | Impulsive · Non-impulsive · Continuous | The physical character of the noise. Impulsive = pile-driving, seismic airgun, UXO; Non-impulsive = vibratory piling, drilling; Continuous = turbine, shipping. This choice swaps the source-level block below (§04 vs §05). |
| TL MODEL | 20·log r · 15·log r | The spreading law used to invert range. 20·log r is spherical (deep-water free field); 15·log r is the practical / shallow-water monopile convention used by BSH and Subacoustech. MuirWave picks a sensible default per source type (15·log r for impulsive, 20·log r for non-impulsive / continuous) — override it if your site guidance differs. |
Impulsive: the pile-driving block
With SOURCE set to Impulsive, MuirWave opens a built-in pile-driving source library so you don't have to hand-enter source levels. Three extra controls appear:
| Control | Stops | Meaning |
|---|---|---|
| HAMMER | 300 · 1900 · 2300 · 3000 · 4000 · 5400 kJ | Hammer blow energy, from a small inshore pile (300 kJ) up to a large monopile hammer (5400 kJ). The published peak and single-strike SEL for the class are read straight from the library. Default 3000 kJ — the Dogger Bank Teesside A class, the validation reference. |
| STRIKES | 500 · 1000 · 2000 · 3000 · 4000 · 6000 | Number of blows to drive the pile. This sets the cumulative SEL₂₄ₕ offset (+10·log₁₀ N — each doubling of strikes adds ≈ 3 dB), so more strikes push the SEL isopleths further out. Default 2000. |
| EXPOSURE | Stationary · Fleeing | How the animal is assumed to accumulate the 24-hour dose. Fleeing (default) has the receptor swim radially away at ≈ 1.5 m/s — the realistic individual-based assessment EIA practice expects. Stationary holds it in place for every strike — the conservative NMFS User-Spreadsheet screening upper bound. |
A caption under the pickers confirms the representative hammer, the unmitigated source levels (SL_peak and SEL_ss at 1 m) and the cumulative SEL₂₄ₕ offset, so you can sanity-check the state at a glance.
Non-impulsive & continuous: the generic block
There is no published hammer library for vibratory piling, drilling, turbines or shipping, so with SOURCE set to Non-impulsive or Continuous the pile-driving block is replaced by two direct inputs you set yourself:
| Field | Range | Meaning |
|---|---|---|
| Source Level | 100 – 240 dB re 1 µPa @ 1 m | The source's broadband level. Default 180 dB — an indicative starting point; substitute your site-measured value. |
| Frequency | 10 Hz – 50 kHz | The dominant source frequency, on the same log slider used elsewhere in MuirWave (default 500 Hz). The auditory weighting is applied here — a real vibratory or turbine source has a meaningful dominant tone, unlike a broadband hammer. |
Reading the outputs
Below the controls the panel stacks up to four readouts. Which ones appear depends on your receptor, source type and compliance jurisdiction.
-
The impact-range tableOne row per hearing group — five for mammals (NMFS: LF / HF / VHF / PW / OW; Southall relabels the two pinniped rows PCW / OCW — codes expanded in the Glossary: LF baleen whales, HF dolphins, VHF porpoises, PW/OW seals & sea lions), four for fish + turtles. Four columns: HEARING GROUP, PEAK (impulsive only), SEL₂₄ₕ† (the dagger flags the accumulation assumption), and GOVERNING. The governing range — the larger of peak and SEL — is highlighted in cyan; that's the radius that matters for that group. A row that reads a rating instead of a number — e.g. (Near) High / (Intermediate) Low / (Far) Low — means Popper publishes only a qualitative relative-risk category for that combination, not a threshold to compute a ring from; see Concepts → Impact thresholds.
-
The summary headlineA large cyan number: the largest mitigation zone across all groups (or the largest mortality / injury isopleth for fish), with the driving group named beneath. A checkmark badge means it's a trustworthy metric; a warning glyph appears only when a stationary screening SEL is driving the headline — a conservative upper bound, not a submission figure.
-
The soft-start rampMammals + impulsive only. A six-row table showing the largest governing range at every hammer-energy stop, with your current hammer highlighted — a visual aid for the JNCC-style soft-start (20-min default, variation by agreement) that escalates from low to operational energy. It recomputes on a background task, so the panel stays responsive.
-
The compliance footer & assumptionsA footer shows the active jurisdiction (flag, short label and a one-line summary of its rule), and below it an ASSUMPTIONS block spells out every simplification — the single-coefficient TL model, the source-spectrum treatment, that soft-start isn't modelled (≈ −1 dB on SEL₂₄ₕ), and that beyond ≈ 3500 m an impulsive signature degrades to non-impulsive (Hastie et al. 2019) — plus the exact citation. Nothing is hidden from a reviewer.
Exporting the methodology
The Export Data & Figures tile opens MuirWave's one Export sheet, scrolled to its DATA & FIGURES section — four formats built entirely from this panel's current selections: scenario inputs, propagation method, criteria and thresholds, and the per-group predicted ranges with full citations. Pick a format, confirm.
| Format | What it is |
|---|---|
| Markdown | A plain .md file that drops straight into §3 of an EIA or academic report. Faithful to your live panel state — source type, receptor, accumulation model, convention, mitigation and pin depth. States its receiver-depth convention for the reviewer: the tabulated ranges are range-only (depth-independent by construction, as in the NMFS Optional User Spreadsheet), and the mapped zone shapes use maximum-over-depth — the worst case anywhere in the water column at each range, the convention BOEM adopts for R95%. |
| Data (CSV) | Scenario preamble, per-hearing-group threshold table, the 0/6/10/15 dB attenuation-sensitivity sweep, the soft-start ramp and a TL-vs-range table, one row per line (RFC 4180). Stays in SI throughout (metres, dB, kJ, Hz) rather than your display-unit preference — including the Level B behavioural-disturbance line, which prints in metres here even though the panel and the other formats show it in whatever unit you've chosen. A trailing PROVENANCE block closes the file: every criteria claim the run actually used, each with its citation and page locator plus the regulatory framework — one line per claim, with a compact machine identifier (claim ID + source-edition checksum) alongside the human citation so the row reconciles without the app open. |
| GIS (GeoJSON) | The source pin plus a governing-isopleth polygon per hearing group, and the JNCC min. 500 m / BSH 750 m regulatory reference rings — real spherical geodesics with correct winding, split into a MultiPolygon on the rare pin whose isopleth crosses the antimeridian. A hearing group whose criterion is a published qualitative rating rather than a number (see Concepts → Impact thresholds) still gets a feature in the file — unlocated, geometry null — so it never silently disappears from a GIS handoff; the rating itself travels in the feature's properties. A top-level provenance object (an additive field per RFC 7946 §6.1 — ignored by any GIS tool that doesn't recognise it) carries the generator, the regulatory framework and every criteria claim used, each with its citation, locator and source edition; the JNCC and BSH reference-ring features each also carry their own source property naming the specific citation that ring is drawn from. |
| Figure (PNG) | The site map with mitigation-zone rings, legend and cartographic furniture (scale bar, north arrow, datum) baked in — 1500×840 px minimum, ready to paste straight into a Word deliverable. A visible credit line is composited under the legend — generator, the criteria claim(s) used and the jurisdiction — so the figure's provenance survives on its own once it's pasted somewhere the surrounding report doesn't travel with it. |
The sheet's other section, REPORTS, holds the full Impact Assessment — nine to ten branded A4 pages combining everything above into one submittable PDF. Both export tiles reach the same sheet: the Acoustics group's Export tile opens on REPORTS; this tile opens on DATA & FIGURES. Scroll to reach the other section from either one. Under its criteria table, the PDF prints its own "Threshold table source(s)" line naming exactly which table and page in the cited regulator document produced the numbers above it — a reviewer never has to take a threshold value on faith.
The Mitigation panel PRO
The second tile in the group opens a dedicated noise-abatement screening surface — and it's the only place mitigation lives. The Impact Ranges panel gives everyone the unmitigated baseline; this panel shows what a mitigation strategy actually does on top of it — per hearing group, across frequency, and with the operational measures a method statement relies on. It is an MuirWave Pro feature; a free user sees an upgrade panel with every impact-range number still visible on screen for free.
Five things stack up in the panel, all reading off the same scenario as Impact Ranges:
-
The system pickerSix options — None / BBC / DBBC / HSD / IHC-NMS / BBC+HSD — each applied as a broadband reduction at the source: Big Bubble Curtain (−10 dB), Double BBC (−15 dB), Hydro-Sound Damper (−9 dB), IHC Noise Mitigation Screen (−17 dB), or a stacked BBC + HSD (−19 dB). It starts at None, so the panel opens on the same unmitigated baseline as Impact Ranges. The selected system's full name and broadband reduction show beneath; a combination (BBC+HSD) notes that its value is measured, not the sum of the single systems.
-
Frequency-dependent insertion lossA toggle switches the mitigation from a flat broadband number to a frequency-dependent insertion loss IL(f) — the curve below then shows where the abatement actually works. Bubble curtains and dampers are weak at the low-frequency piling peak and strongest across the mid-band, so spectral mitigation is more protective for high-frequency-hearing species (porpoises) than for low-frequency hearers (baleen whales) — a distinction a single number can't make. The amber shape under the curve is the pile's own source spectrum, so you can see the mismatch at a glance.
-
The mitigated-vs-unmitigated trade-offOne row per hearing group, reading 3.5 km → 720 m ×4.9 — the unmitigated governing range struck through, the mitigated range in bold, and the reduction factor as a badge. When a system fully removes a group's injury zone the row reads cleared. This is the headline an EIA reviewer wants: what the strategy buys, per species. Where the mitigated side is governed by peak pressure — which soft-start and ADD don't reduce, since both work by moving animals off before full power, not by cutting the pulse itself — the headline range can look untouched even with a measure switched on. When that happens and the measure is doing real work on the cumulative side, a second dose (SEL₂₄ₕ) line appears underneath the row, showing the same struck-through → bold → factor pattern for the dose isopleth, with a footnote explaining that operational measures cut dose, not peak. A static-looking headline row isn't a bug — the dose line is where to look for what the toggle actually bought.
-
Operational measuresTwo toggles credit measures that work by moving animals off before full power. Soft-start ramp (the JNCC 20-min-default escalation) is credited as a modest early-flee head-start for all groups. Acoustic deterrent (ADD) is credited a larger head-start — but for toothed whales only (dolphins, porpoises): seals habituate to deterrents (or are attracted to them), and ADD efficacy on baleen whales is poorly evidenced, so both are deliberately not credited. The panel says so in plain language.
-
The BSH 750 m compliance gateUnder a BSH (Germany) compliance jurisdiction, for impulsive mammal scenarios, this panel carries the BSH dual-threshold gate: the predicted Peak SPL against the 190 dB limit and single-strike SEL₀₅ against the 160 dB limit at exactly 750 m (a BSH approval condition since 2008, codified in the BMU Schallschutzkonzept), with a per-metric headroom badge and an overall PASS / EXCEEDED verdict. It reads off the same scenario as Impact Ranges, so the two never disagree.